
Notice
Recent Posts
Recent Comments
Link
반응형
| 일 | 월 | 화 | 수 | 목 | 금 | 토 |
|---|---|---|---|---|---|---|
| 1 | 2 | 3 | ||||
| 4 | 5 | 6 | 7 | 8 | 9 | 10 |
| 11 | 12 | 13 | 14 | 15 | 16 | 17 |
| 18 | 19 | 20 | 21 | 22 | 23 | 24 |
| 25 | 26 | 27 | 28 | 29 | 30 | 31 |
Tags
- chromeextention
- pandas
- 로컬 런타임
- ollama
- Python
- sLLM
- streamlit
- EC2
- 정치기 필기
- djangorestframework
- aws
- Jupyterlab
- ai캠프
- lightsail
- pytorch
- django
- 머신러닝
- 티스토리챌린지
- ai 캠프
- 파이썬
- finpilot
- mifare
- conda
- 오블완
- team_project
- Github
- ML
- seaborn
- mysql
- ai_캠프
Archives
- Today
- Total
greatsangho의 이야기
캠프35~36일차 - 2차 팀프로젝트 본문
https://github.com/greatsangho/SKN05-2ST-2TEAM/tree/main
GitHub - greatsangho/SKN05-2ST-2TEAM: 허상호,신혜원,안태영,윤상혁,박초연
허상호,신혜원,안태영,윤상혁,박초연. Contribute to greatsangho/SKN05-2ST-2TEAM development by creating an account on GitHub.
github.com
- 선정 주제: 캘리포니아 지역 통신사 고객 이탈 예측
- 데이터 수: 행 7,044개, 열 66개
- 프로젝트 필요성(배경): 한국 통신시장 점유
- 프로젝트 목표: 캘리포니아 A통신사 고객 이탈률 예측을 통해 통신 시장에 대한 고찰
내가 한 일
- 데이터 전처리 : 결측치 처리 및 유용한 column만 남기고 제거하기
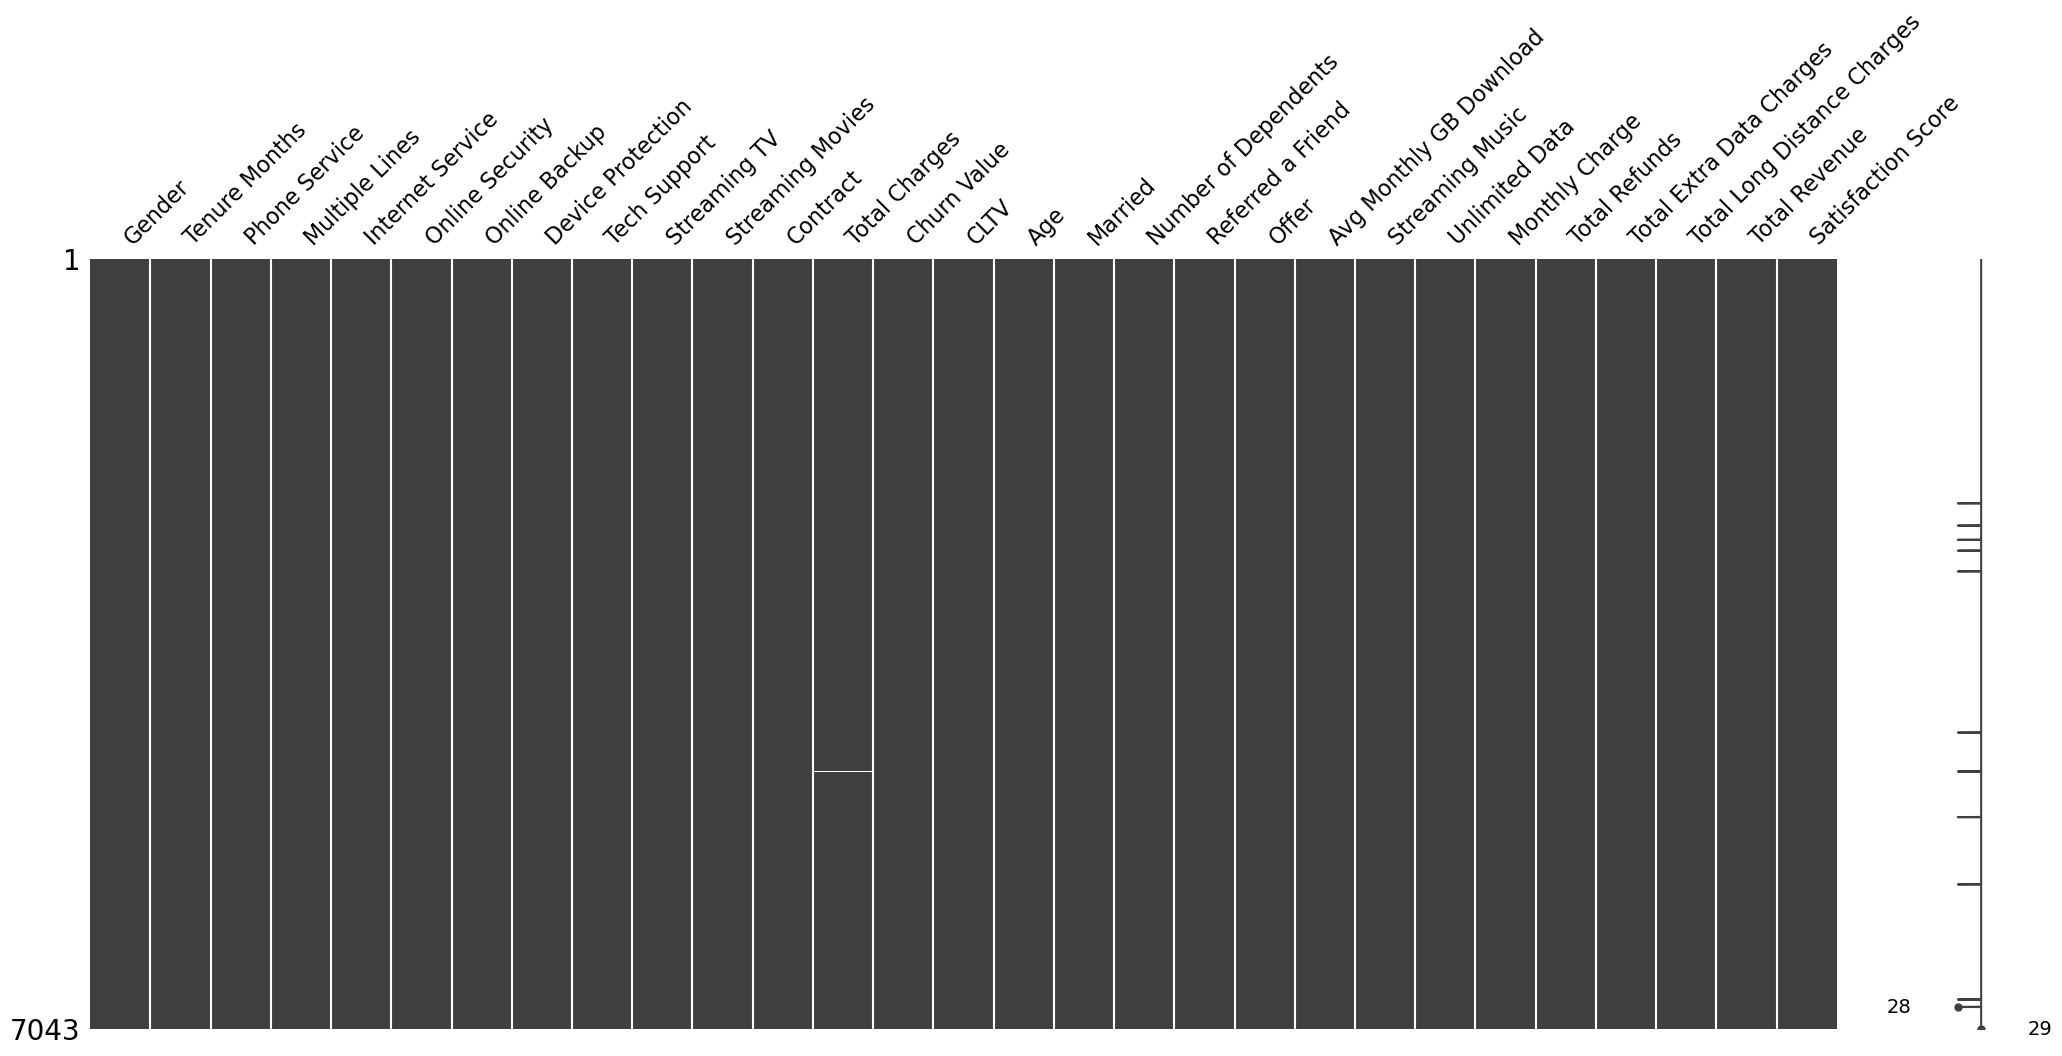
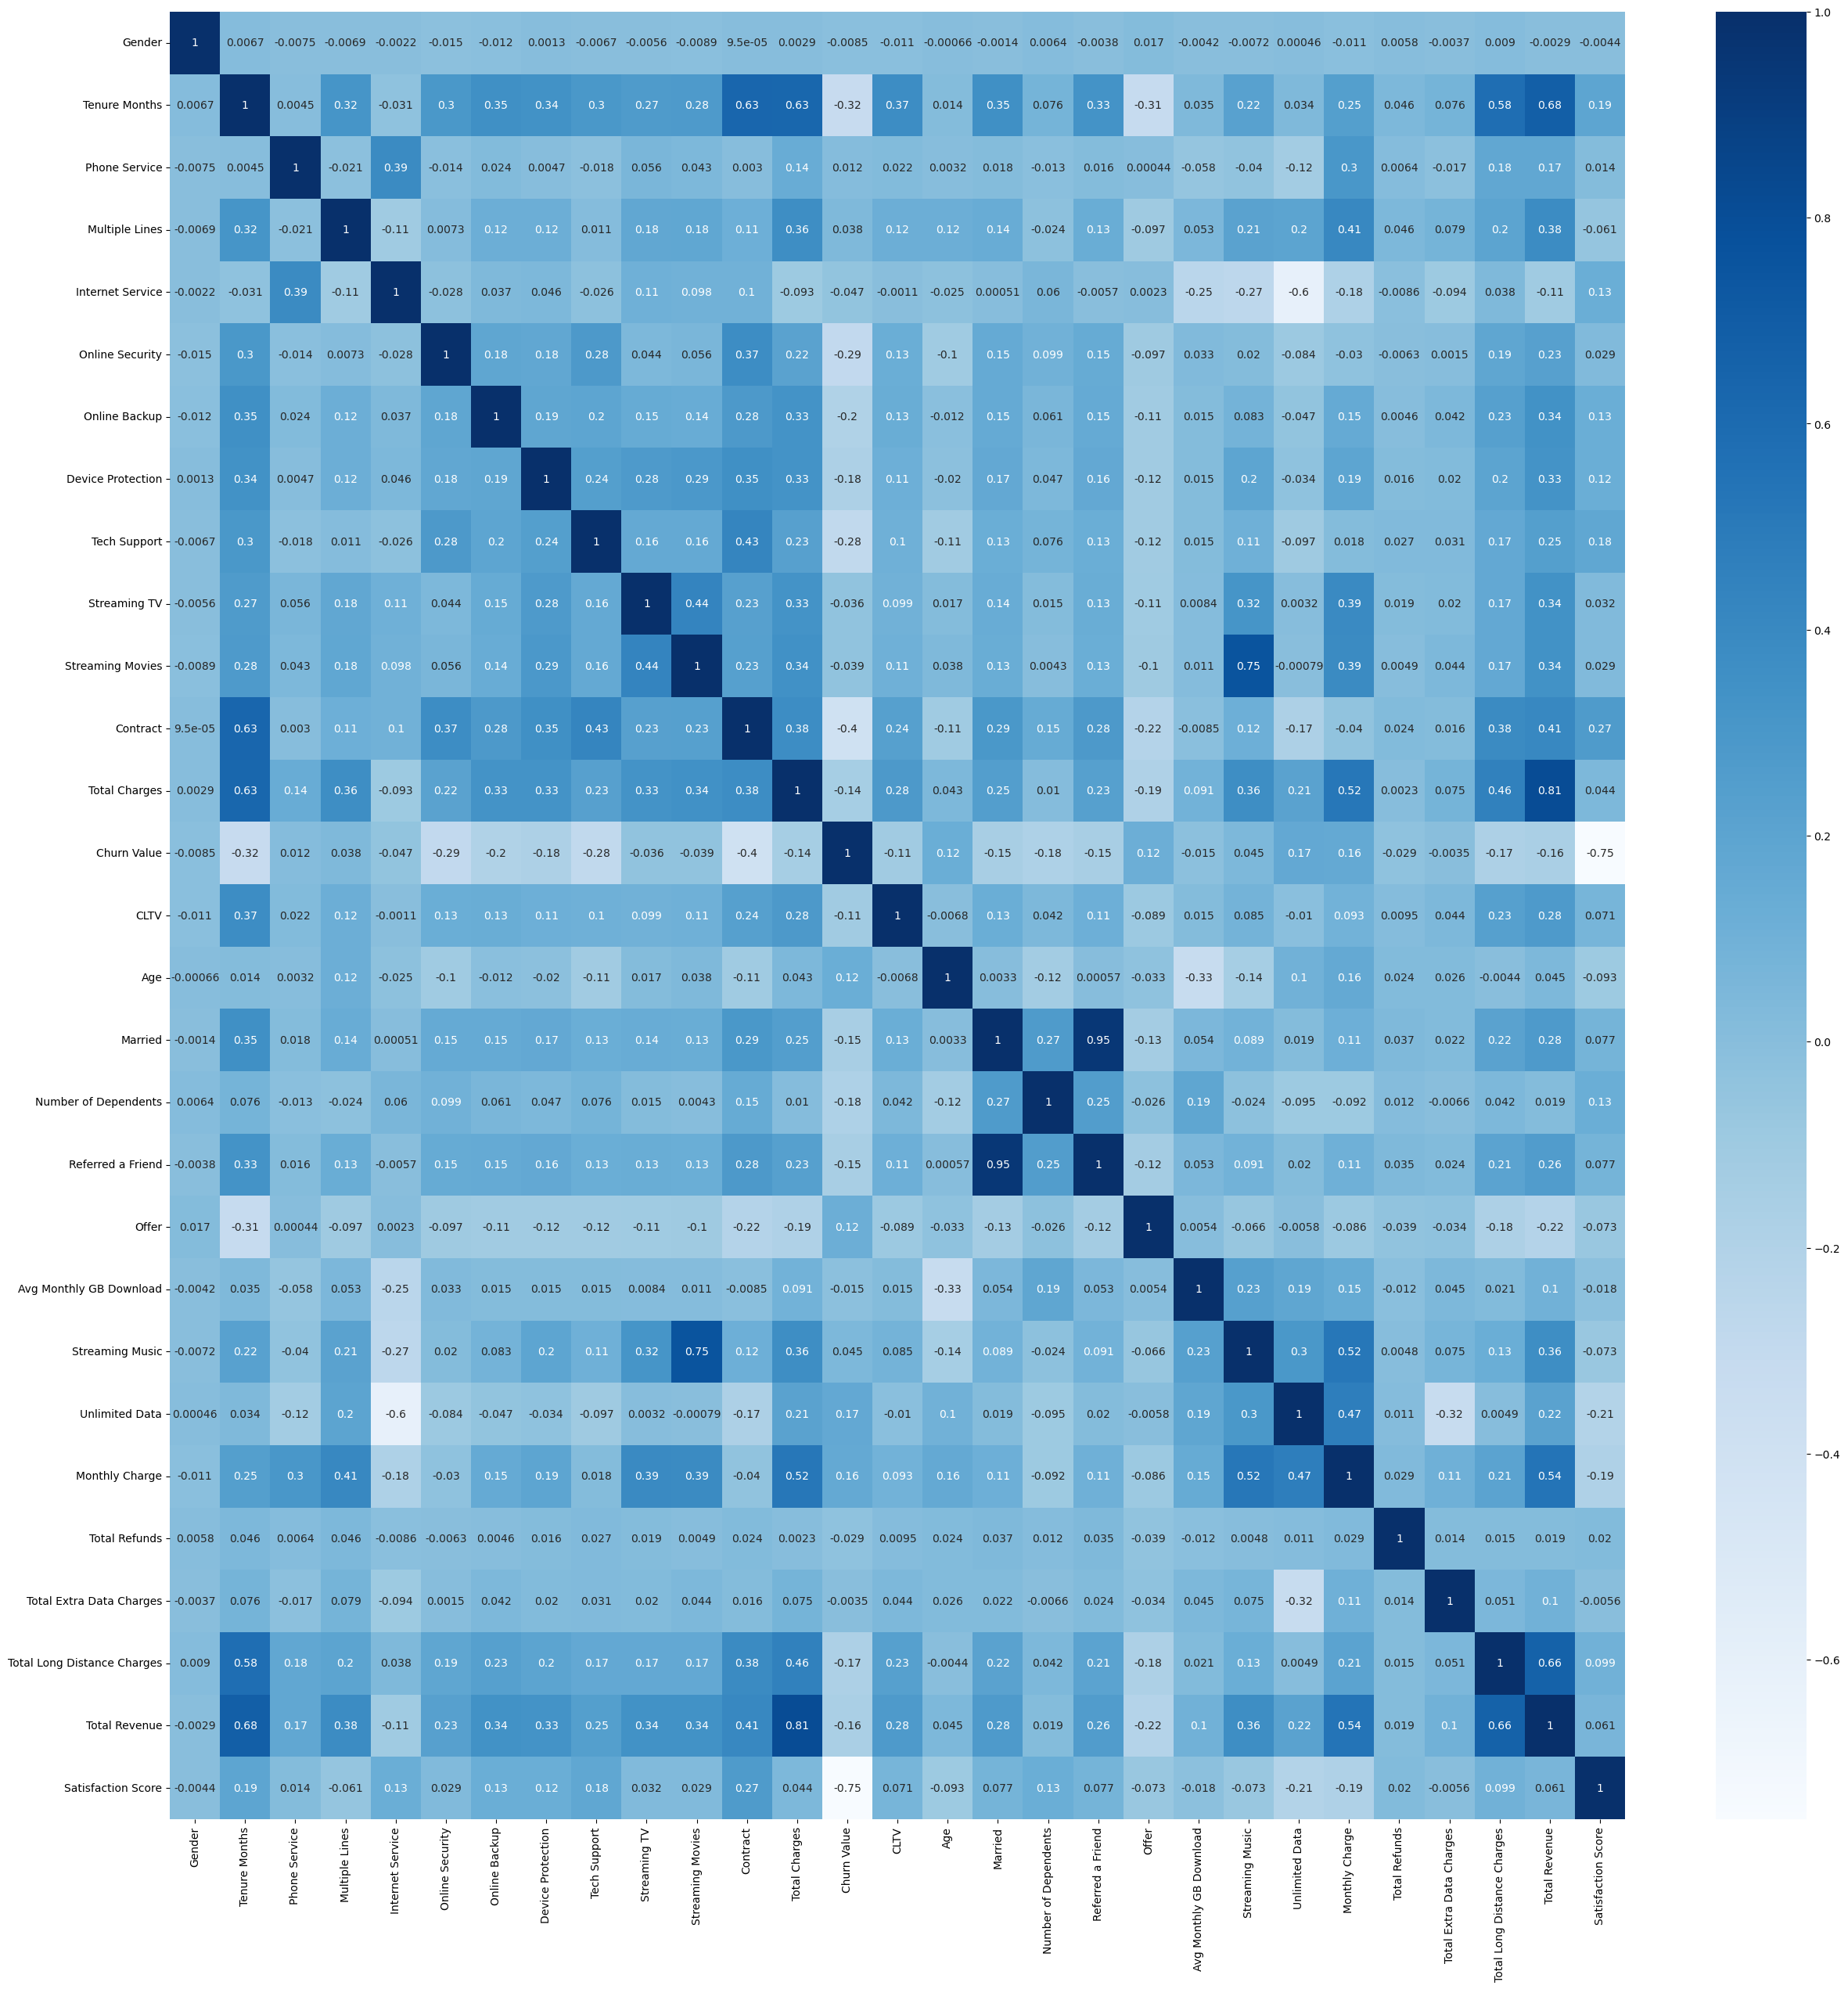
Heatmap을 이용하여 결측치 및 높은 상관관계 변수 제거
- 모델 최적화
사용한 모듈
import warnings
import numpy as np
import pandas as pd
import seaborn as sns
import missingno as msno
import matplotlib.pyplot as plt
from sklearn.svm import SVC
from sklearn.pipeline import Pipeline
from sklearn.preprocessing import LabelEncoder
from sklearn.preprocessing import StandardScaler
from sklearn.model_selection import train_test_split , GridSearchCV
from sklearn.metrics import classification_report
from sklearn.model_selection import cross_val_predict
from sklearn.linear_model import LogisticRegression
from sklearn.neighbors import KNeighborsClassifier
from sklearn.tree import DecisionTreeClassifier
from sklearn.ensemble import RandomForestClassifier, AdaBoostClassifier, GradientBoostingClassifier, StackingClassifier, VotingClassifier
from xgboost import XGBRFClassifier, XGBClassifier
from catboost import CatBoostClassifier
from lightgbm import LGBMClassifier
from sklearn.metrics import classification_report, confusion_matrix
기본 모델 확인 - classification_report를 통한 churn accuracy 기준 평가
# 모델 선정, 학습 및 평가 진행.

df = df2.copy()
X = df.drop(["Churn Value"], axis=1)
y = df["Churn Value"]

X_train, X_test, y_train, y_test = train_test_split(X, y, test_size=0.25, random_state=42)

models = [('LOG', LogisticRegression()),
          ('KNN', KNeighborsClassifier()),
          ('CART', DecisionTreeClassifier()),
          ('RF', RandomForestClassifier()),
          ("AdaBoost", AdaBoostClassifier()),
          ('GBM', GradientBoostingClassifier()),
          ("XGBoost", XGBRFClassifier(objective='reg:squarederror')),
          ("LightGBM", LGBMClassifier())]

f1_score_list = []

for name, clf in models:
    acc = cross_val_predict(clf, X_test, y_test, cv=5)
    print('*'*50)
    print(name)
    print(classification_report(y_test,acc))
    print()

    # Confusion matrix 만들기
    cm = confusion_matrix(y_test, acc)

    plt.figure(figsize=(8, 6))
    sns.heatmap(cm, annot=True, fmt='d', cmap='Blues',
                xticklabels=['Not Exited', 'Exited'],
                yticklabels=['Not Exited', 'Exited'])
    plt.title('Confusion Matrix')
    plt.xlabel('Predicted Label')
    plt.ylabel('True Label')
    plt.show()
앙상블, 스테킹
# 스태킹
base_models = [
    ('xgb', XGBRFClassifier(random_state=42, use_label_encoder=False, eval_metric='mlogloss', n_jobs=-1, colsample_bytree = 0.7, gamma = 0, learning_rate = 1, max_depth = 19, n_estimators = 200)),  # Adjusted parameters for XGBClassifier
    ('rf', RandomForestClassifier(random_state=42, n_jobs=-1)),
]

meta_model = LogisticRegression(max_iter=10000)

clf = StackingClassifier(estimators=base_models, final_estimator=meta_model, n_jobs=-1)

clf.fit(X_train, y_train)

scores = cross_val_predict(clf, X_test, y_test, cv=5)
print(classification_report(y_test, scores))

# Confusion matrix 만들기
cm = confusion_matrix(y_test, acc)

plt.figure(figsize=(8, 6))
sns.heatmap(cm, annot=True, fmt='d', cmap='Blues',
            xticklabels=['Not Exited', 'Exited'],
            yticklabels=['Not Exited', 'Exited'])
plt.title('Confusion Matrix')
plt.xlabel('Predicted Label')
plt.ylabel('True Label')
plt.show()
# soft voting
base_models = [
('lr', LogisticRegression(random_state=42, max_iter=10000)), # Increased max_iter
('rf', RandomForestClassifier(random_state=42, n_jobs=-1)),
('xgb', XGBRFClassifier(random_state=42, use_label_encoder=False, eval_metric='mlogloss', n_jobs=-1, colsample_bytree = 0.7, gamma = 0, learning_rate = 1, max_depth = 19, n_estimators = 200)), # Adjusted parameters for XGBClassifier
("XGBoost", XGBClassifier(objective='reg:squarederror')), # objective='binary:logistic
]
clf = VotingClassifier(estimators=base_models, voting='soft', n_jobs=-1)
clf.fit(X_train, y_train)
scores = cross_val_predict(clf, X_test, y_test, cv=5)
print(classification_report(y_test, scores))
# Confusion matrix
cm = confusion_matrix(y_test, scores)
plt.figure(figsize=(8, 6))
sns.heatmap(cm, annot=True, fmt='d', cmap='Blues',
xticklabels=['Not Exited', 'Exited'],
yticklabels=['Not Exited', 'Exited'])
plt.title('Confusion Matrix')
plt.xlabel('Predicted Label')
plt.ylabel('True Label')
plt.show()Autogluon
# AutoGluon - AutoML
from autogluon.tabular import TabularDataset, TabularPredictor
ag_train = X_train.copy()
ag_train['Churn'] = y_train
ag_test = X_test
ag_test['Churn'] = y_test

train_data = TabularDataset(ag_train)

time_limit = 3600*6
predictor = TabularPredictor(label='Churn',eval_metric='f1_macro').fit(train_data=train_data,presets='best_quality',num_stack_levels=3,time_limit=time_limit,num_gpus=0)

leaderboard = predictor.leaderboard(ag_test)
print(leaderboard)

predictions = predictor.predict(ag_test)

print(classification_report(y_test,predictions))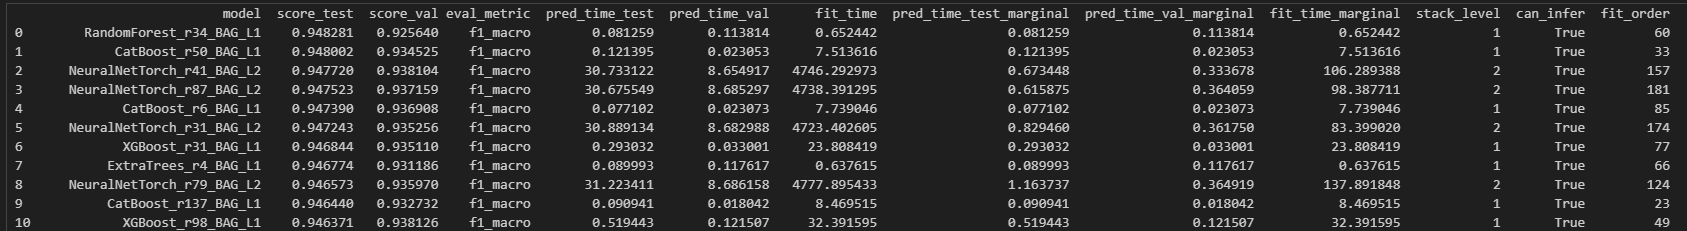
그리드 서치
gbm = GradientBoostingClassifier()
param_grid = {
'learning_rate': [0.01, 0.1, 0.2],
'n_estimators': [100, 200],
}
grid_search = GridSearchCV(
estimator=gbm,
param_grid=param_grid,
scoring='f1_macro', # or another metric like 'accuracy', 'f1_macro'
n_jobs=-1,
cv=3,
verbose=1
)
grid_search.fit(X_train, y_train)
best_model = grid_search.best_estimator_
y_pred = best_model.predict(X_test)
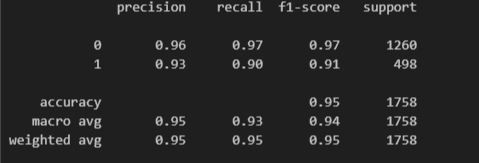
print(classification_report(y_test, y_pred))
print("Best Parameters: ", grid_search.best_params_)
# Confusion matrix
cm = confusion_matrix(y_test, y_pred)
plt.figure(figsize=(8, 6))
sns.heatmap(cm, annot=True, fmt='d', cmap='Blues',
xticklabels=['Not Exited', 'Exited'],
yticklabels=['Not Exited', 'Exited'])
plt.title('Confusion Matrix')
plt.xlabel('Predicted Label')
plt.ylabel('True Label')
plt.show()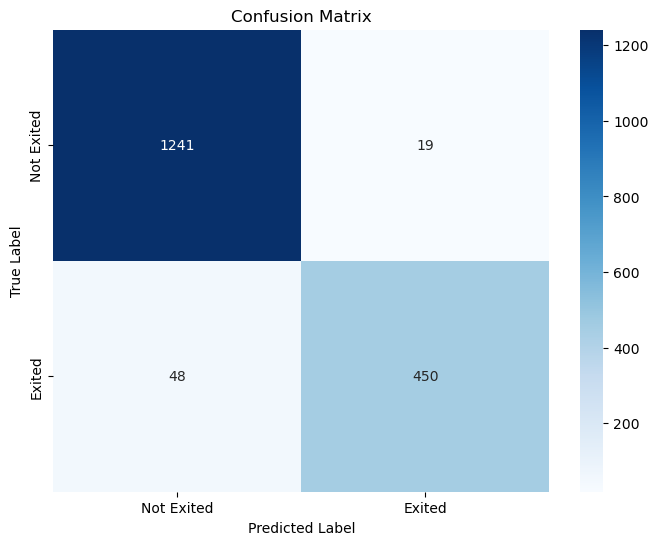
- Streamlit을 이용한 사용자의 조건 변화에 따른 이탈률 예측
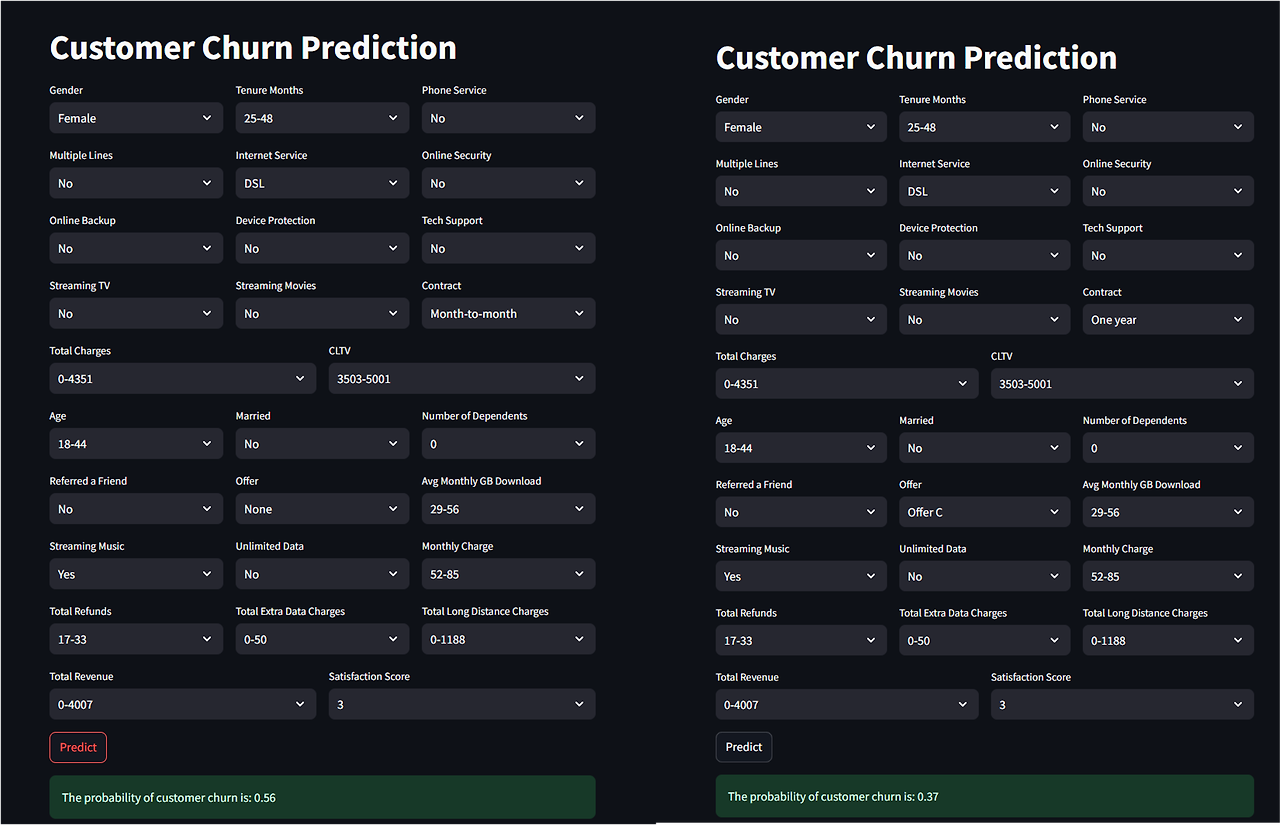
학습한 모델을 pkl 파일로 저장한 뒤 각 값을 선택하여 예측할 수 있도록 구현함
import streamlit as st
import pickle
import pandas as pd

# Load the trained model
with open('model_gbm.pkl', 'rb') as file:
    model = pickle.load(file)

# Define the prediction function
def predict_churn(features):
    prediction = model.predict_proba([features])
    return prediction[0][1]  # Probability of churn

# Streamlit app
st.title("Customer Churn Prediction")

# Create input fields for each feature in the specified order
features = []

# Group features in threes based on the specified order
feature_groups = [
    # Group 1
    [
        ('Gender', ['Male', 'Female'], lambda x: 1 if x == 'Male' else 0),
        ('Tenure Months', ['0-24', '25-48', '49-72'], lambda x: {"0-24": 0, "25-48": 1, "49-72": 2}[x]),
        ('Phone Service', ['Yes', 'No'], lambda x: 1 if x == 'Yes' else 0)
    ],
    # Group 2
    [
        ('Multiple Lines', ['No', 'Yes', 'No phone service'], lambda x: {'No': 0, 'Yes': 2, 'No phone service': 1}[x]),
        ('Internet Service', ['DSL', 'Fiber optic', 'No'], lambda x: {'DSL': 0, 'Fiber optic': 1, 'No': 2}[x]),
        ('Online Security', ['Yes', 'No', 'No internet service'], lambda x: {'Yes': 2, 'No': 0, 'No internet service': 1}[x])
    ],
    # Group 3
    [
        ('Online Backup', ['Yes', 'No', 'No internet service'], lambda x: {'Yes': 2, 'No': 0, 'No internet service': 1}[x]),
        ('Device Protection', ['Yes', 'No', 'No internet service'], lambda x: {'Yes': 2, 'No': 0, 'No internet service': 1}[x]),
        ('Tech Support', ['Yes', 'No', 'No internet service'], lambda x: {'Yes': 2, 'No': 0, 'No internet service': 1}[x])
    ],
    # Group 4
    [
        ('Streaming TV', ['Yes', 'No', 'No internet service'], lambda x: {'Yes': 2, 'No': 0, 'No internet service': 1}[x]),
        ('Streaming Movies', ['Yes', 'No', 'No internet service'], lambda x: {'Yes': 2, 'No': 0, 'No internet service': 1}[x]),
        ('Contract', ['Month-to-month', 'One year', 'Two year'], lambda x: {'Month-to-month': 0, 'One year': 1, 'Two year': 2}[x])
    ],
    # Group 5
    [
        ('Total Charges', ["0-4351", "4352-9000"], lambda x: {"0-4351": 0, "4352-9000": 1}[x]),
        ('CLTV', ["0-3502", "3503-5001", "5002-6500"], lambda x: {"0-3502": 0, "3503-5001": 1, "5002-6500": 2}[x])
    ],
    # Group 6
    [
        ('Age', ["0-17", "18-44", "45-64", "65+"], lambda x: {"0-17": 0, "18-44": 1, "45-64": 2, "65+": 3}[x]),
        ('Married', ['Yes', 'No'], lambda x: 1 if x == 'Yes' else 0),
        ('Number of Dependents', ['0', '1', '2', '3+'], lambda x: {"0": 0, "1": 1, "2": 2, "3+": 3}[x])
    ],
    # Group 7
    [
        ('Referred a Friend', ['Yes', 'No'], lambda x: 1 if x == 'Yes' else 0),
        ('Offer', ['None', 'Offer A', 'Offer B', 'Offer C', 'Offer D', 'Offer E'],
         lambda x: {'None': 0, 'Offer A': 1, 'Offer B': 2, 'Offer C': 3, 'Offer D': 4, 'Offer E': 5}[x]),
        ('Avg Monthly GB Download', ["0-28", "29-56", "57-100"], lambda x: {"0-28": 0, "29-56": 1, "57-100": 2}[x])
    ],
    # Group 8
    [
        ('Streaming Music', ['Yes', 'No'], lambda x: 1 if x == 'Yes' else 0),
        ('Unlimited Data', ['Yes', 'No'], lambda x: 1 if x == 'Yes' else 0),
        ('Monthly Charge', ["0-51", "52-85", "86-120"], lambda x: {"0-51": 0, "52-85": 1, "86-120": 2}[x])
    ],
    # Group 9
    [
        ('Total Refunds', ["0-16", "17-33", "34-50"], lambda x: {"0-16": 0, "17-33": 1, "34-50": 2}[x]),
        ('Total Extra Data Charges', ["0-50", "51-100", "101-150"], lambda x: {"0-50": 0, "51-100": 1, "101-150": 2}[x]),
        ('Total Long Distance Charges', ["0-1188", "1199-2376", "2377-3565"], lambda x: {"0-1188": 0, "1199-2376": 1, "2377-3565": 2}[x]),
    ],
    # Group 10
    [
        ('Total Revenue', ["0-4007", "4008-7993", "7994-12000"], lambda x: {"0-4007": 0, "4008-7993": 1, "7994-12000": 2}[x]),
        ('Satisfaction Score', ['1', '2', '3', '4', '5'], lambda x: int(x)),
    ]
]

# Loop through the feature groups and create input fields
for group in feature_groups:
    cols = st.columns(len(group))  # Create columns for the current group
    for col, (label, options, encoding) in zip(cols, group):
        with col:
            value = st.selectbox(label, options)
            encoded_value = encoding(value)
            features.append(encoded_value)

# Predict button
if st.button("Predict"):
    if len(features) == 28:  # Ensure we have the correct number of features
        probability = predict_churn(features)
        st.success(f"The probability of customer churn is: {probability:.2f}")
        # st.success(f"The probability of customer churn is: {features}")
    else:
        st.error("There was an error with the input features. Please check the inputs.")
후기
데이콘 대회 준비가 프로젝트 진행에 많은 도움이 되었다. 구현하고자 하는것과 전처리 속도를 매우 빠르게 진행할 수 있었고, 다양한 모델도 적용하는데 문제가 없었다.
시각화 관련 부분이 부족했는데 팀 프로젝트를 진행하면서 데이터 및 모델 시각화에 대해 배울 수 있었다. 첫번째 프로젝트는 힘겹게 진행한 반면, 이번에는 코드와 관련된 모든 부분에 참여하며 프로젝트를 주도적으로 진행할 수 있어서 좋았다.
반응형
'프로그래밍 > SK AI 캠프' 카테고리의 다른 글
| 캠프51일차 - 프롬프트 엔지니어링 응용(랭체인) (9) | 2024.11.07 |
|---|---|
| 캠프37일차 - 자연어 처리 기초(코러스, 문장구조 이해) (2) | 2024.10.18 |
| WSL2 conda 환경에 Tensorflow2와 CUDA 연결하여 설치하기 (0) | 2024.10.13 |
| 도커를 활용한 colab 로컬 런타임 연결 (1) | 2024.10.12 |
| SK AI 캠프 7주차 후기 (2) | 2024.10.07 |
'프로그래밍/SK AI 캠프' Related Articles
more


